
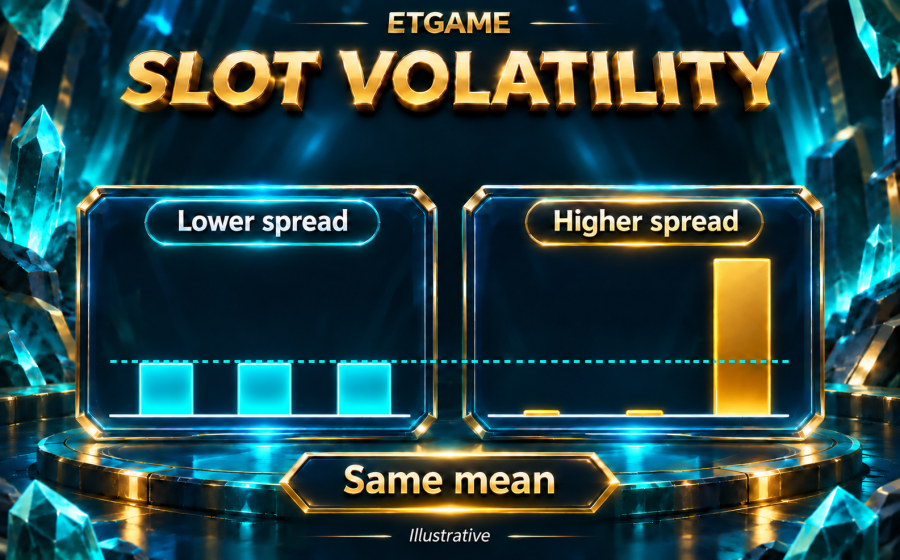
Slot volatility meaning: variation around an average
Slot volatility describes how widely outcomes vary. A game whose returns depend heavily on rare, large awards can behave very differently from one built around more frequent, smaller awards, even when their theoretical return percentages match.
The UK Gambling Commission’s monitoring guide explains volatility using the distribution of prizes and commonly the standard deviation. That is a statistical description, not a promise about the next spin or a personal schedule of wins.
Start by separating three questions: what is the long-run average, how often does an event pay, and how large or variable are the awards? One percentage cannot answer all three.
Two invented games with the same average
Invented distribution: assume each outcome below is equally likely and each play costs $1. Game A pays $1 on nine of ten outcomes and $0 on the tenth. Game B pays $9 on one outcome and $0 on nine outcomes.
| Measure | Game A | Game B |
|---|---|---|
| Prizes across all ten outcomes | $9 | $9 |
| Mean payout per $1 play | $0.90 | $0.90 |
| Paying outcomes | 9 of 10 | 1 of 10 |
| Largest model prize | $1 | $9 |
The average is the same, but Game B’s outcomes spread farther from it. These are toy probability models, not ten-spin scripts or specifications for any named game. A real sequence does not have to reproduce these counts.
A payout is not always a profit
In Game A, a $1 payout merely returns the $1 stake. Counting that as a paying event is reasonable under the stated definition, but calling it a $1 profit would be wrong. For each event, net result equals payout minus stake.
That distinction matters when reading hit-frequency claims. Ask what the source counts as a “hit”: any positive payout, a result exceeding the stake, a feature trigger, or something else? Compare only figures with matching definitions.
Why a short session cannot establish slot volatility
A short run of small payouts does not prove that a game’s entire prize distribution is low volatility. You may not have observed the rare outcomes that contribute much of its variation. Likewise, a single large payout does not let you calculate the game’s theoretical return.
The Commission’s RTP calculation guide explains why observed returns need to be considered alongside sample size and volatility. A dashboard showing a recent percentage is not automatically a statement of the underlying mathematical design.
There is also no basis for treating a losing streak as evidence that a random game’s large prize is now due. An outcome history and a prize distribution answer different questions.
Read the label with its source and version
Record the provider’s wording and scale exactly. A “high” label or a four-out-of-five graphic does not supply a universal conversion into a hit rate, a losing-streak length or a required bankroll. Check whether the rating covers the version and mode you are comparing.
For a feature-level reading example, the public Money Train 2 profile separates different sequences and character actions. Understanding that process helps interpret a description; it still cannot turn a volatility label into a session forecast.
Use the average-return figure for its stated long-run meaning, use a clearly defined hit rate for event frequency, and use volatility for variation. Keep those notes separate.
Discussion